G



Forecasted Win Probability
 Forecast
Last updated Aug 28, 2:11 PM

Jocelyn Benson
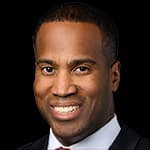
John James
Decision Desk HQ's forecast for this race blends 82% fundamentals, 5% polls, and 13% markets. Fundamentals capture the structural conditions of the race, including partisan baseline adjusted for national environment, incumbency, presidential party cycle effects, and net campaign financial advantage.
| Candidate | Result |
|---|---|
| Jocelyn Benson | 49.00% |
| John James | 44.00% |
| Other Option | 7.00% |
| Candidate | Result |
|---|---|
| Jocelyn Benson | 52.00% |
| John James | 47.00% |
| Other Option | 1.00% |
| Candidate | Result |
|---|---|
| Jocelyn Benson | 53.00% |
| John James | 37.00% |
| Other Option | 10.00% |